Rethinking Commissions

Discipline: UX Design UI Design

Collaborators: Sales Team Payroll ControllerFinance Dev Team
User Stories
Sales Person
As a sales person, I would like to know how much my commission check will be for the pay period.
Controller
As the Controller, I work hard with my payroll team to make sure commission checks are calculated correctly. After paydays, my inbox is flooded with questions, often from sales people thinking their pay isn't correct. A better designed page would make things more clear for sales people, and save me time from answering emails.
The Challenge
Redesigning the current Commissions page to communicate clearly, earnings to the sales people. Also, displaying the correct data in a clear easy-to-understand way to save our payroll team time, not having to answer to so many questions every pay period.
Discovery
Through user interviews I discovered that commissions were split based on business units. Every sales person was in a business unit, sizes ranged between 4-8 people, and each unit had a business unit leader. Do we allow filtering for users to look at business units?
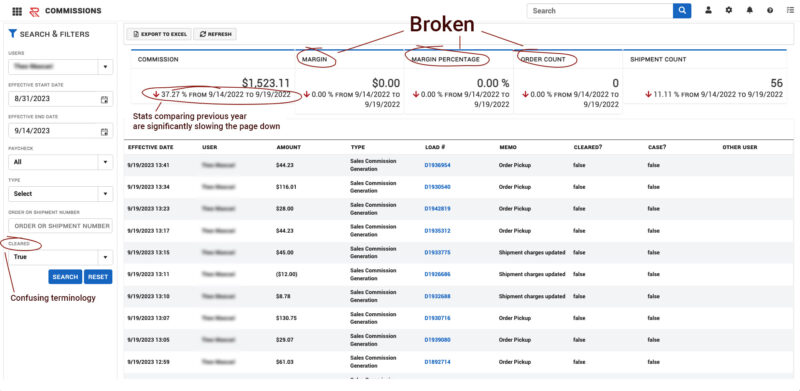
Some of the confusion coming from sales people was in the terminology used. Things like "Cleared" is an accounting term used when something was paid. Sales people weren't familiar with it though.
Collaborating with the dev team, we quickly discovered that the stats at the top of each page comparing current numbers to the previous year was severely slowing the page down.
The Approach
Taking qualitative data and applying it.
- Clear data that would benefit sales and payroll.
- Simple language that would increase understanding
- Filters based on permissions. Business Unit leads would be able to see their BU commission. Other individuals would only be able to see their own.
How were we going to achieve this? The dashboard updating would have be through conversations with the data team. Our company was in our infancy of moving data to a data warehouse, but that was being done for reasons just like this. As far as the dashboard being applicable to to other departments, we'll have to create separate dashboard for them as well. Of course, getting the right stats on the dashboard would come down to iterating and testing.

